
MBBR Media Selection: Surface Area That Actually Works
Why the specific surface area on an MBBR media datasheet overstates usable biofilm area, and what to size carriers on instead.
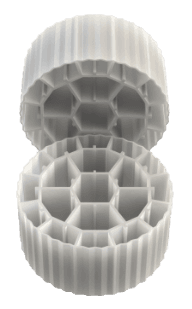
MBBR media selection is usually settled by comparing one number across quotations: the specific surface area printed on the datasheet, in square metres of carrier surface per cubic metre of bulk carrier volume. It is the wrong number to decide on, and the error is not academic. Because that figure sits directly in the denominator of the carrier-volume calculation, an optimistic surface area produces an undersized carrier charge, which produces an undersized tank, which shows up two years later as an effluent that will not hold ammonia through a cold-weather peak. The carrier that fails is rarely defective. It simply never had as much usable biofilm area as the catalogue claimed.
What the Specific Surface Area Number Actually Measures
Specific surface area is a geometric property. A carrier is modelled as a solid, its wetted external and internal surfaces are computed or measured, and the total is divided by the bulk volume the carriers occupy when packed. Published values for commercial MBBR carriers typically fall between 350 and 1,200 m2/m3, with void ratios commonly in the 60 to 90 per cent range (Bengtson, Biological Wastewater Treatment Processes II: MBBR Processes, drawing on Odegaard).
Nothing in that measurement asks whether a microorganism can live on the surface it counted. Geometry counts the outer rim of a wheel-type carrier, the leading edges of every fin, and the narrow slots between adjacent vanes. Biology treats those three regions very differently. The rim is scoured, the fin edges are abraded, and the narrow slots may seal shut. The datasheet counts all of it identically.
This is why the higher-surface-area carrier is not automatically the better carrier. Beyond a certain packing density, the designer is buying geometry that the process cannot use, and is often buying hydraulic problems along with it.
Biofilm Only Uses the First Fraction of a Millimetre
The physical reason usable area is finite is diffusion. Substrate and oxygen enter a biofilm by molecular diffusion and are consumed as they travel inward, so concentration falls with depth. Below the point where the limiting substrate reaches zero, the biomass is metabolically inert with respect to that reaction.
Reported penetration depths are small. Oxygen and nutrient gradients in biofilms generally extend somewhere between 50 and 500 micrometres, and full substrate penetration is commonly reported at under 100 micrometres, with effective reaction-limited diffusion depth usually quoted in the 0.2 to 0.5 mm band. Anything grown beyond that depth adds mass and headloss without adding reaction rate.
Why This Reframes the Whole Specification
If the active layer is a few hundred micrometres thick, then reactor capacity scales with area, not with the volume of biofilm the carrier can hold. A carrier geometry that encourages thick, unsheared growth is not storing extra treatment capacity; it is storing dead biomass in slots that were counted as surface area. This is also why an MBBR does not respond to overloading the way an activated sludge basin does. You cannot compensate by growing more biomass, because the extra biomass sits below the diffusion front.
It also explains a common operational observation: a reactor that looks healthy, with heavily coated carriers, can nitrify worse than the same reactor with visibly thinner, lighter-coloured growth. Nitrifiers are slow-growing and oxygen-hungry, and they lose the competition for the outer, oxygenated layer when heterotrophs are fed a high organic load. Thickness is not a proxy for capacity.
Protected Surface Area: The Number That Should Drive Selection
Protected surface area is the subset of geometric surface where biofilm is shielded from the shear and collision that continuously strip it. Carriers in a fluidised bed collide with each other and with tank walls at high frequency, and biofilm on exposed rims and outer faces is removed almost as fast as it forms. Design literature therefore deducts collision-exposed surfaces and reports protected surface area separately, typically in the range of roughly 300 to 800 m2/m3, with recommended design values for many carrier types clustering well below their headline geometric figures.
Two carriers quoting the same specific surface area can differ by nearly a factor of two in the area that actually carries active biomass. The difference is geometry, not marketing.
The geometry that creates protected area is a compromise. Channels must be deep enough that biofilm inside them is sheltered from collision, and open enough that liquid exchanges freely and shear still limits thickness to something near the diffusion depth. Push the channels too narrow in pursuit of a bigger catalogue number and the carrier accumulates biofilm faster than shear can trim it, the passages bridge over, and the interior stops exchanging. At that point the surface area is not merely unprotected, it is unavailable.
When comparing quotations, the correct question is not which carrier has more surface area, but which carrier retains active biofilm on the largest fraction of it under the shear conditions of the specific reactor. That answer depends on the wastewater. High-fibre, hair-bearing or greasy influent needs larger internal passages, in the range of several millimetres, to avoid bridging; a clarified municipal effluent going to tertiary nitrification can tolerate a finer, higher-area geometry.
Fill Ratio Is a Hydraulic Limit, Not a Free Design Variable
Once the required carrier volume is known, fill ratio converts it into tank volume. It is tempting to treat fill ratio as a lever for shrinking the tank: double the fill, halve the basin. The physics does not allow it.
Carriers must circulate. In an aerobic MBBR the aeration grid supplies both oxygen and the roll pattern that keeps the bed moving; in an anoxic cell a mechanical mixer does the same job without air. As fill increases, carriers spend more time in contact and less time in free liquid, the roll pattern degrades, and both oxygen transfer and mixing suffer. Published guidance places practical fill in the 40 to 70 per cent band, with many designs settling near 50 per cent, and warns that volumetric fill above roughly 67 per cent risks poor oxygen transfer and blinding of the carrier retention screens. Mechanically mixed anoxic cells are more sensitive still, with effective circulation generally reported below about 55 per cent fill.
The Retention Screens Are Part of the Media Decision
Carrier retention screens are frequently treated as a downstream detail and specified after the media are bought. They should be sized alongside them. Screens are dimensioned by allowable headloss, typically on the order of 5 to 10 cm, with superficial hydraulic loading generally kept below roughly 50 to 55 m/hr across all flow conditions including peak hour. Screen openings are commonly wedge-wire or mesh at around 6 mm, or perforated plate with 5 to 6 mm orifices, which means the smallest carrier dimension has to be chosen with the screen in mind, not the other way round. Aerobic reactors are also commonly designed to keep the forward approach velocity, taken on the cross-section perpendicular to flow, in the region of 30 to 35 m/hr so that the bed is not swept toward the outlet.
Working the Sizing Chain in the Right Order
The design sequence is short and each step depends on a number from the step before, which is precisely why an optimistic surface area propagates so cleanly into an undersized tank. The controlling parameter is surface area loading rate, SALR, expressed as grams of the constituent being removed per square metre of carrier surface per day.
From SALR, the chain runs: loading rate in g/d divided by design SALR gives required carrier surface area; that area divided by carrier specific surface area gives carrier volume; carrier volume divided by fill fraction gives tank volume; and liquid volume follows from tank volume less the solid fraction of the carriers. Published design values put BOD removal broadly in the range of about 5 to 15 g BOD/m2/d and nitrification an order of magnitude lower, roughly 0.5 to 1.2 g NH3-N/m2/d, with lower loading required where the downstream objective is nitrification. One worked reference case uses 7.5 g BOD/m2/d for a 90 to 95 per cent BOD removal target.
Worked Example: BOD Removal at 5,000 m3/d
Take a municipal plant treating 5,000 m3/d with a primary effluent BOD of 175 mg/L, targeting 90 to 95 per cent BOD removal. From the published SALR table for that removal target, the design loading rate is 7.5 g BOD/m2/d. The carrier under consideration is quoted at 600 m2/m3 geometric specific surface area, 60 per cent void, and the design fill is 50 per cent.
- BOD load = 5,000 m3/d x 175 g/m3 = 875,000 g BOD/d
- Required carrier surface area = 875,000 / 7.5 = 116,700 m2
- Carrier volume on the quoted 600 m2/m3 = 116,700 / 600 = 194.4 m3
- Tank volume at 50 per cent fill = 194.4 / 0.50 = 388.9 m3
Now repeat the calculation with the figure that matters. Suppose the same carrier's protected surface area, once collision-exposed rims and outer faces are deducted, is 400 m2/m3 rather than 600. Nothing about the load or the SALR changes; only the divisor in step three does.
- Carrier volume on 400 m2/m3 protected area = 116,700 / 400 = 291.7 m3
- Tank volume at 50 per cent fill = 291.7 / 0.50 = 583.3 m3
- Liquid volume = 583.3 - 291.7 x (1 - 0.60) = 466.7 m3
- HRT at design average flow = 466.7 / 5,000 x 24 = 2.2 hours
The two answers differ by 194 m3 of tank. Put the other way round, a basin built on the geometric figure is 33 per cent smaller than the one the process actually needs, and no amount of commissioning effort recovers that. The plant will look acceptable at average summer load, because an MBBR has some margin at low loading, and will fail its ammonia consent on the first cold-weather peak. The entire error entered at one substitution in step three.
The Same Flow, Sized for Nitrification
The asymmetry between carbon removal and nitrification is easiest to see by running the same flow through a nitrification duty. Take 25 mg/L of ammonia nitrogen reaching the nitrification stage, and a design SALR of 0.8 g NH3-N/m2/d, which sits mid-range in the published band.
- NH3-N load = 5,000 m3/d x 25 g/m3 = 125,000 g NH3-N/d
- Required carrier surface area = 125,000 / 0.8 = 156,300 m2
- Carrier volume at 400 m2/m3 protected area = 156,300 / 400 = 390.6 m3
- Tank volume at 50 per cent fill = 390.6 / 0.50 = 781.3 m3
The nitrification stage carries one seventh of the mass load of the BOD stage and still needs about a third more carrier volume. That is not an anomaly in the arithmetic; it is the slow growth rate of nitrifiers and their loss of the outer, oxygenated layer to heterotrophs expressed as a design number. Anyone sizing a nitrifying MBBR from a carbon-removal rule of thumb will be short by a wide margin, and the shortfall compounds with the protected-area error if both are made together.
Checking Fill Ratio and Screen Area on the Same Case
Fill ratio and screen area are the two constraints most often settled after the media order is placed. Both are quick to check against the numbers already in hand. Taking the 291.7 m3 carrier charge from the BOD case:
- At 40 per cent fill, tank volume = 291.7 / 0.40 = 729.2 m3
- At 50 per cent fill, tank volume = 291.7 / 0.50 = 583.3 m3
- At 67 per cent fill, tank volume = 291.7 / 0.67 = 435.3 m3
- Peak hour flow at a peak factor of 4 = 5,000 x 4 / 24 = 833 m3/h
- Minimum retention screen area at a 50 m/h superficial limit = 833 / 50 = 16.7 m2
The 67 per cent case is the one to be suspicious of. It saves 148 m3 of concrete against the 50 per cent design, which is exactly why it gets proposed, and it sits at the published ceiling above which oxygen transfer degrades and screens begin to blind. The saving is real and the risk is real, and the decision belongs with the process engineer rather than the civil cost estimate. The screen figure is the more common oversight: 16.7 m2 is a substantial submerged screen, and a design that sized it on average flow of 208 m3/h would have specified roughly a quarter of the area required and would blind on the first storm peak.
Two things in this chain deserve more scepticism than they usually get. First, removal does not track loading linearly: the ratio of surface area removal rate to surface area loading rate approaches unity only at low loading and falls away as SALR rises, so a reactor designed at the top of the loading band buys less removal per square metre than the arithmetic suggests. Second, the specific surface area used in step two should be the area the biofilm can actually hold, not the geometric maximum. Substituting protected area for geometric area at that step is the single most useful correction available to a designer.
Failure Modes Worth Screening For Before Purchase
Most MBBR disappointments trace back to a small set of causes, all of which are decidable at specification stage rather than at commissioning.
- Effective area shortfall — the carrier was sized on geometric surface area while only the protected fraction ever carried active biofilm. Symptom: the reactor never reaches design removal even at correct fill and adequate aeration.
- Channel bridging — internal passages too narrow for the influent's fibre, hair or grease content, so growth seals the interior. Symptom: carriers grow heavy and dark, and performance drops as loading rises rather than recovering.
- Over-filling — fill fraction pushed past the point where the bed circulates freely. Symptom: stagnant zones, uneven carrier colour across the tank, and falling oxygen transfer efficiency at unchanged airflow.
- Screen blinding — retention screen area sized on average flow rather than peak hour, or opening size mismatched to the smallest carrier dimension. Symptom: rising headloss across the outlet and, eventually, upstream flooding.
- Buoyancy drift — carriers are made near-neutrally buoyant, with high-density polyethylene grades sitting around 0.94 to 0.97 g/cm3 so that a mature biofilm brings the assembly close to the density of water. Carriers far off that window either float in a mat or settle in a dead layer, and neither is recoverable by adjusting air.
- Nitrifier washout under organic load — heterotrophs occupy the aerated outer layer when the upstream stage under-performs. Symptom: ammonia breakthrough that correlates with influent BOD, not with ammonia load.
A Defensible Selection Sequence
A specification that survives commissioning tends to follow the same order. Fix the treatment objective and therefore the SALR band first, since nitrification and BOD removal do not share a design point. Establish the influent's physical character next, because fibre and grease set the minimum internal passage dimension and therefore cap how much area the geometry can honestly offer. Ask the supplier for protected surface area and for the basis on which it was derived, and use that figure in the carrier volume calculation. Choose fill fraction against the mixing method, not against the tank you wish you had. Then size the retention screens and aeration grid against peak hour flow, and check that the smallest carrier dimension is comfortably larger than the screen opening.
Done in that order, the sizing arithmetic is straightforward and the assumptions are all visible. Done in the usual order, starting from the largest surface area figure on the quotation, the arithmetic is equally straightforward and every assumption is hidden inside one number.
The judgement to carry away is simple enough to state and easy to forget under commercial pressure: an MBBR is sized by the area that holds living, substrate-fed biofilm, and that area is always smaller than the geometric figure on the datasheet. Treat specific surface area as an upper bound, protected surface area as the design input, and fill ratio as a hydraulic constraint rather than a cost lever, and the reactor will behave the way the calculation said it would. AIRFIN manufactures MBBR carriers in three geometries, designated A4, A12 and A16, and our process engineers are available to review carrier selection, fill fraction and screen sizing for a new build or an existing reactor that is not meeting its removal targets.